Back to Projects
Climate Data Visualizer
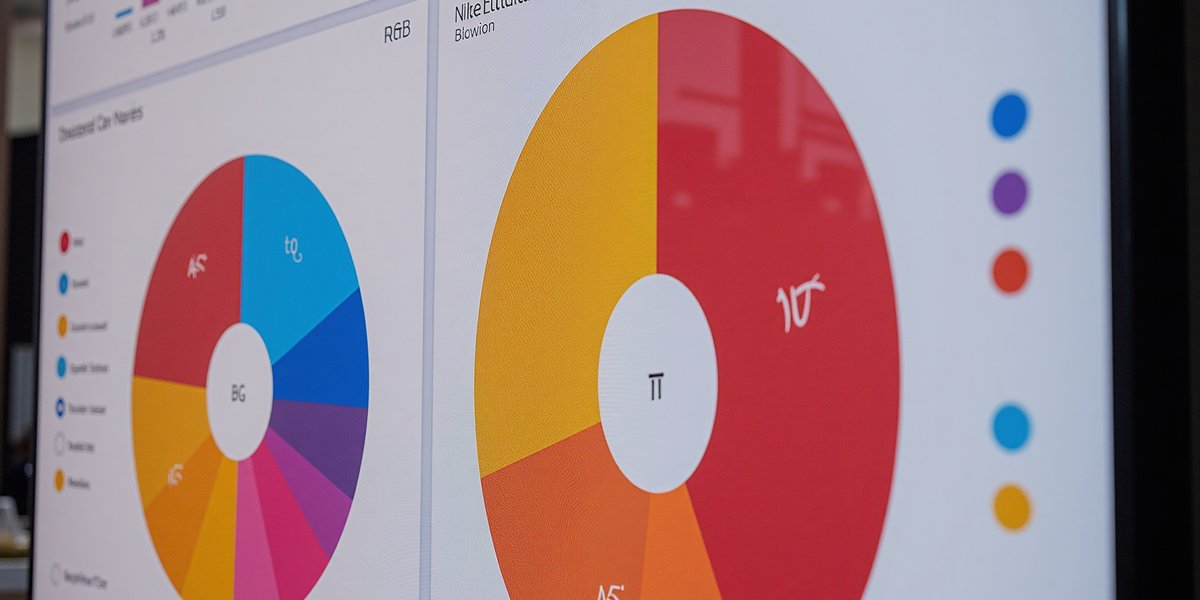
A data visualization tool that transforms raw climate datasets into intuitive, interactive charts designed for classroom use. Teachers can load regional data and students explore trends through guided visual narratives.
Key Outcomes
1
Processed and cleaned 5 years of regional climate data from public datasets
2
Built interactive chart components with filtering and comparison features
3
Adopted by 2 science classes as a supplementary teaching tool
4
Won Silver Medal at the National Science Olympiad (Data category)